Read Built-in Tour Analytics and Improve Traffic Sources and CTAs
Learn how to review Panoee's built-in tour analytics and use visits, sources, countries, devices, and top pages to improve tour CTAs.
Read Built-in Tour Analytics and Improve Traffic Sources and CTAs
Panoee includes built-in analytics inside the tour editor, so you can review how visitors interact with a published virtual tour. Use these metrics to understand traffic quality, compare sources, and improve the call-to-action buttons that help visitors contact your team.
Before You Start
- Publish or share the tour so it can receive visitor traffic.
- Wait until the tour has enough visits to make the analytics useful.
- Add at least one CTA if you want to evaluate conversion opportunities.
Steps
-
Open the Tour Editor
Open the project in Panoee Studio and enter the tour editor.
-
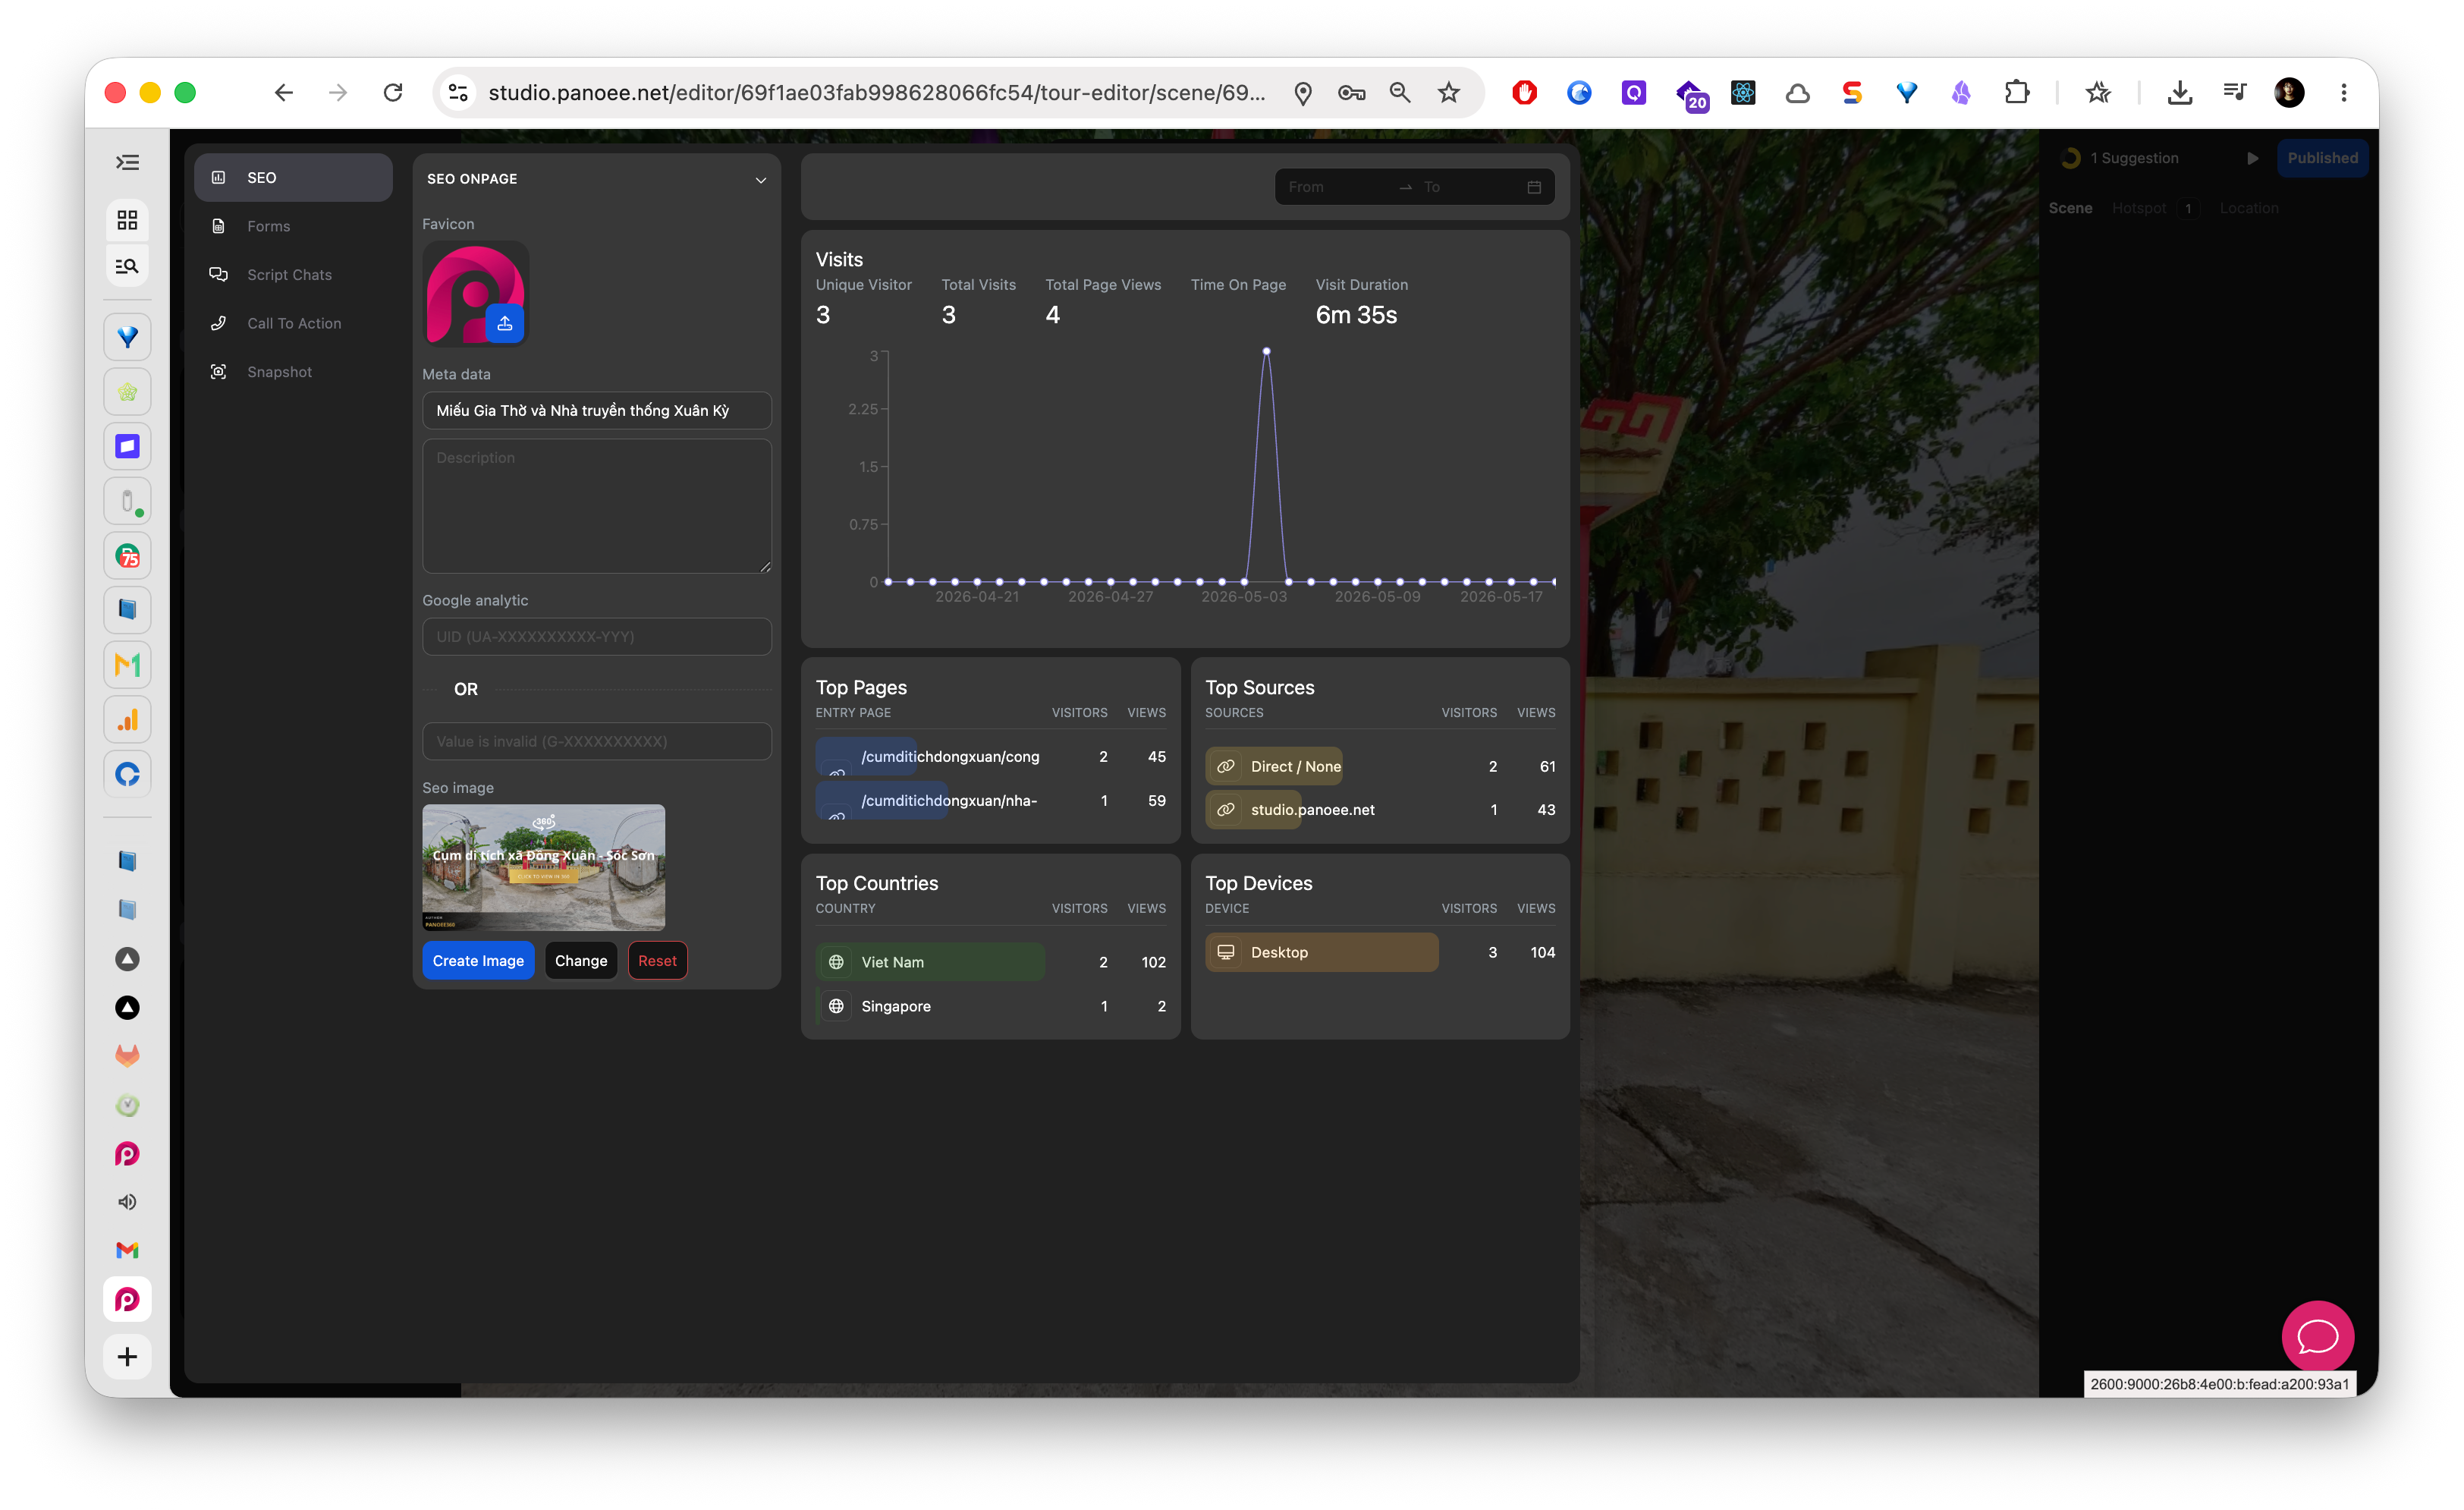
Review the Analytics Panel
Use the analytics panel on the right side of the marketing settings area. The panel summarizes visitor activity for the selected date range.
-
Choose the Date Range
Use the date filter to review the time period you care about, such as a campaign launch, client presentation period, or recent sharing window.
-
Check Visitor Volume
Review high-level metrics such as unique visitors, visits, page views, time on page, and visit duration. These numbers help you understand whether the tour is attracting meaningful attention.
-
Review Top Pages
Check the top page list to see which tour pages or scenes receive the most attention. Use this to identify the strongest entry points or the scenes that need better guidance.
-
Compare Traffic Sources
Review source data to understand where visitors come from. If one channel brings most traffic, make sure the tour content and CTA match that channel's audience.
-
Check Country and Device Data
Review country and device breakdowns. This helps you decide whether the tour experience should prioritize mobile visitors, desktop visitors, or specific markets.
-
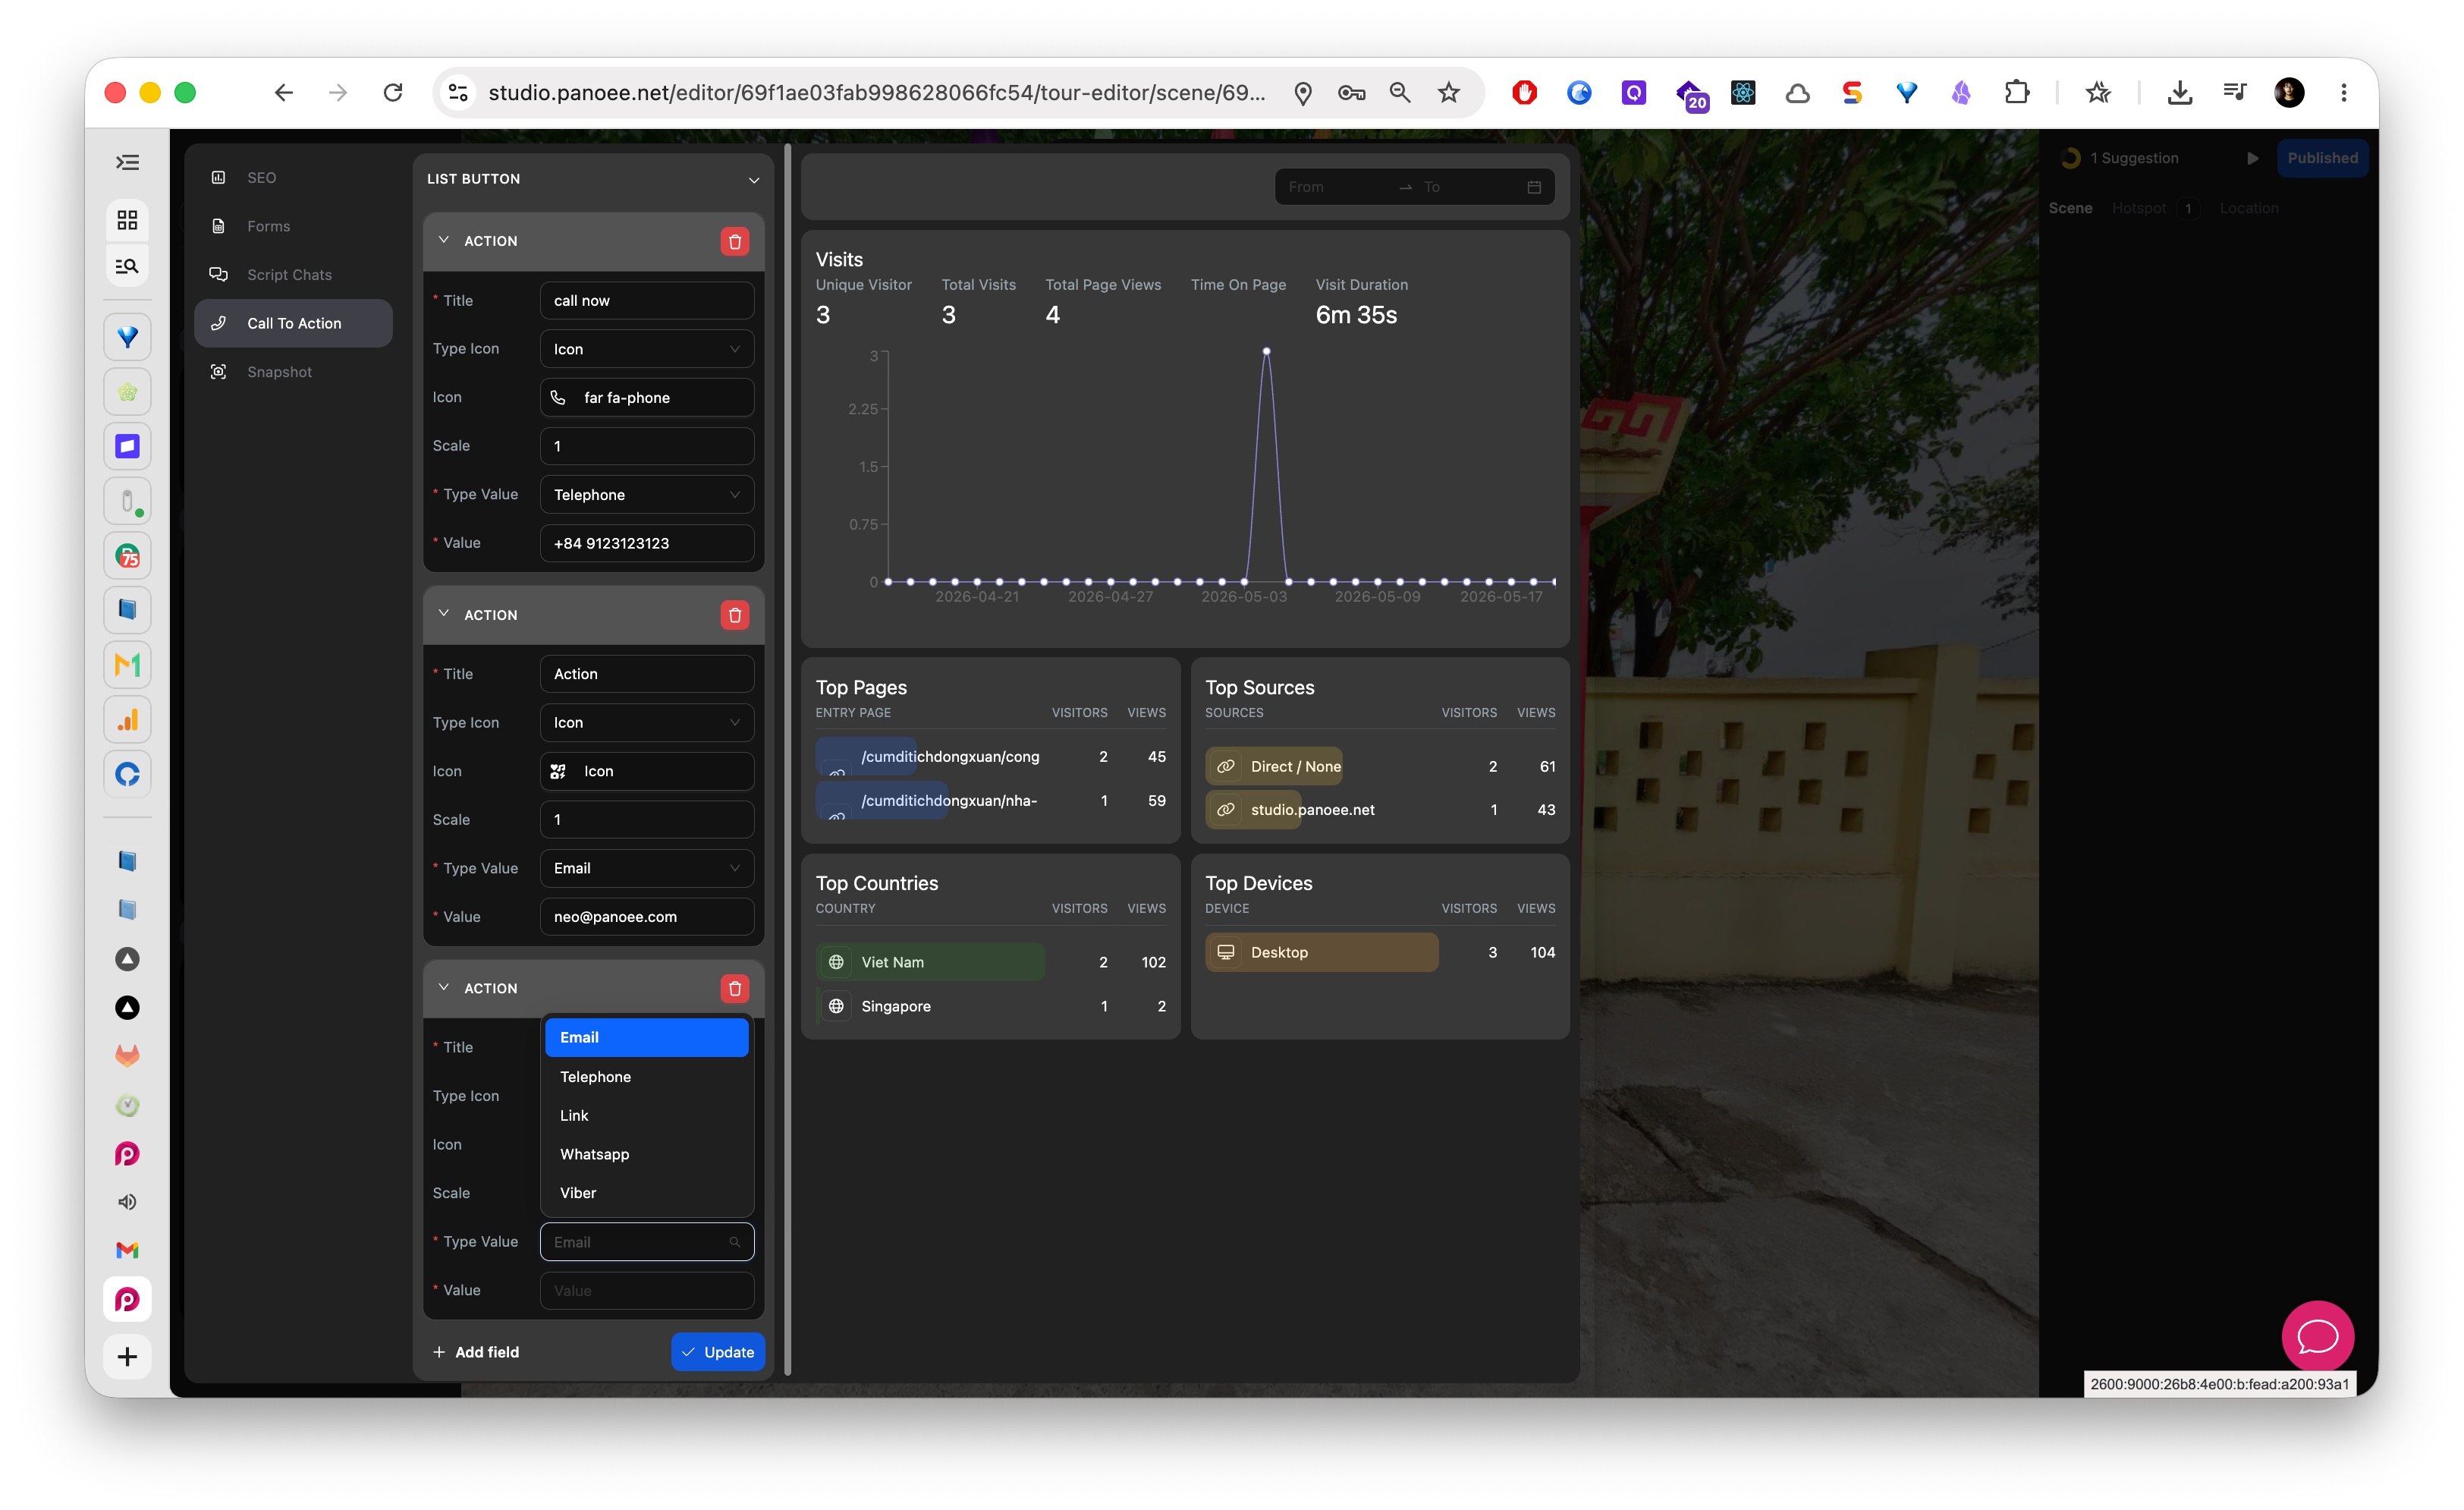
Review CTA Placement and Clarity
Open Call To Action and check whether the CTA buttons match what the analytics suggest visitors need.
-
Improve the CTA
Update CTA labels, destinations, or contact channels based on visitor behavior. For example, mobile-heavy traffic may benefit from phone, WhatsApp, or Viber actions, while desktop traffic may respond better to a booking link or contact form.
-
Review Again After Changes
Give the updated tour time to collect traffic, then compare analytics again using a similar date range.
What to Look For
| Analytics Area | How to Use It |
|---|---|
| Unique visitors and visits | Understand reach and repeat engagement. |
| Page views and top pages | Identify the scenes or pages visitors open most. |
| Time on page and visit duration | Check whether visitors stay long enough to explore. |
| Sources | Compare channels such as direct visits, campaigns, referrals, or social traffic. |
| Countries | Adapt language, CTA channel, or sales follow-up for key markets. |
| Devices | Prioritize mobile-friendly CTAs when mobile traffic is high. |
Notes
- Analytics are most useful after the tour has enough traffic to show patterns.
- Do not judge performance from a very small number of visits.
- Use built-in analytics for quick review inside Panoee. Use Google Analytics when your team needs deeper cross-channel reporting.